


Using Sales and Customer Trends to Drive Growth

Grow your cannabis business with LeafLink’s suite of real-time data & analytics products
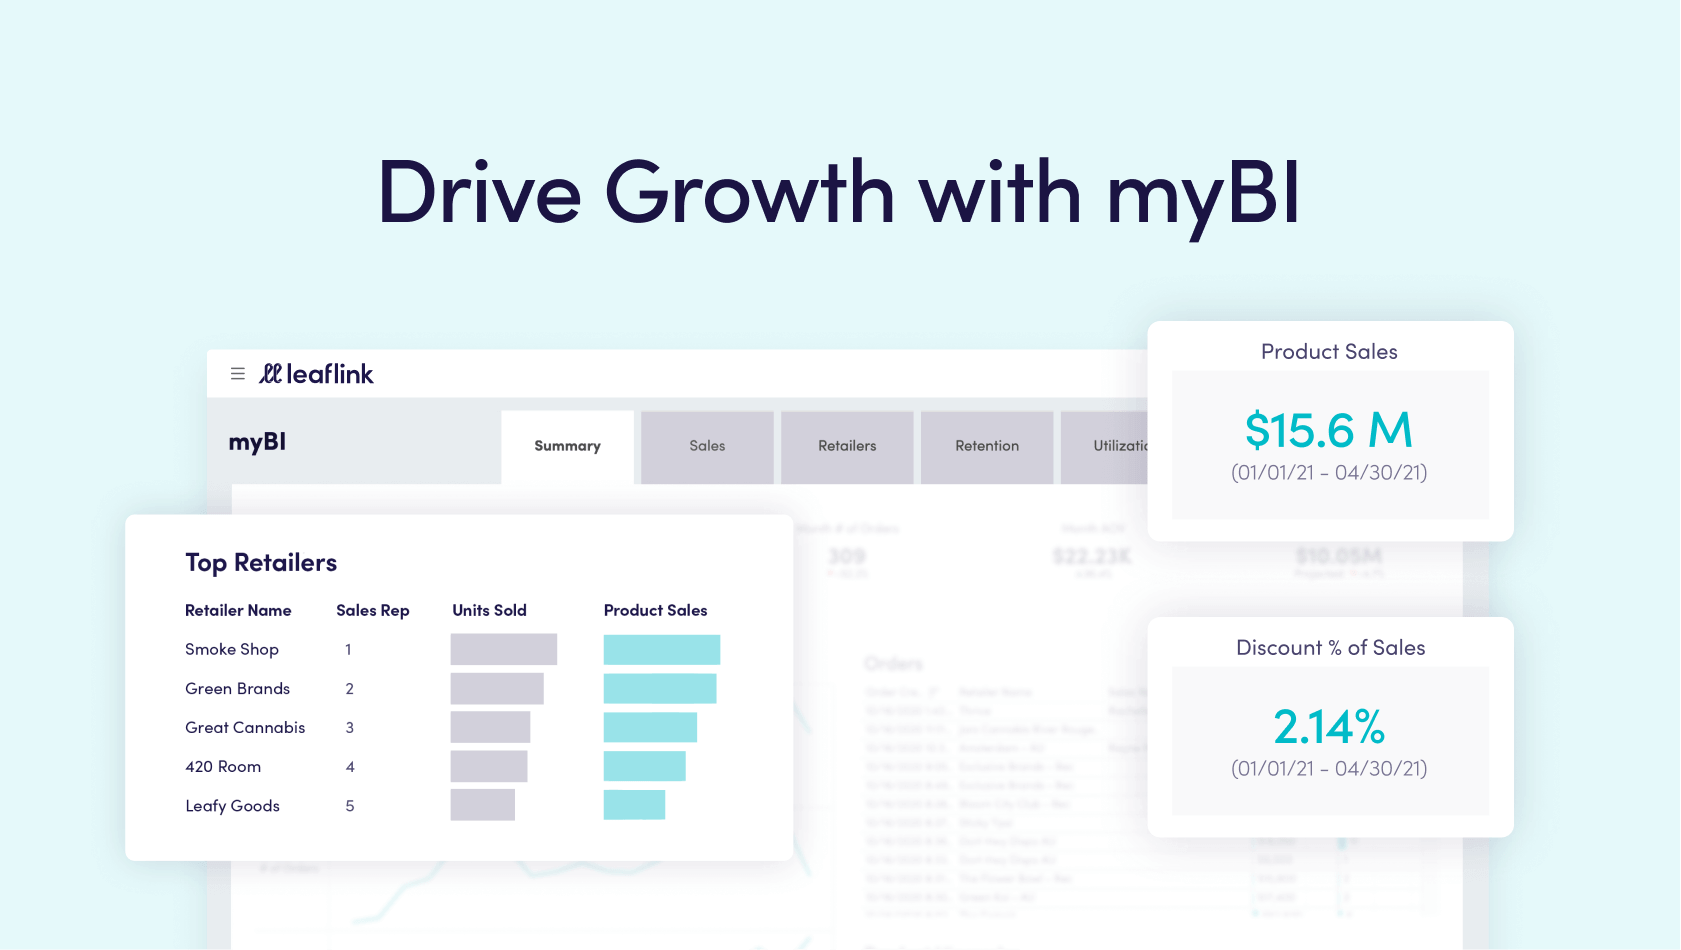
myBI is a business intelligence tool that brands can use to more effectively segment retail customers, prioritize sales efforts, forecast product sales, and grow brand recognition in a data-driven way.
With myBI, your brand will have access to:
– Key internal performance data to optimize your sales team for success
– Deep customer insights to know when and where to dial up sales and marketing efforts
– Customizable data visualizations and KPI monitoring
Below, we’ll highlight some of the features you can use to drive growth:
Summary Tab
Which products or product lines are contributing to your growth and which are lagging behind? Which stores are ordering your products and how often? Who do your sales need to focus on? myBI provides a customizable view of your sales data and can answer these questions and more.
On the Summary tab, your myBI ‘home page,’ you’ll find high-level stats that you can filter for a more detailed view.

Use the Summary tab to more effectively strategize sales efforts and forecast top-selling products, then dive deeper into specific metrics and results through the other myBI tabs including Sales, Retailers, Retention, Utilization, and Products.
Sales Tab
The Sales tab on myBI offers a breakdown of weekly, monthly, or yearly sales viewable by dollars, units, sales representative, by brand and product line. This information can give you a more granular perspective of your sales approach and how it could be improved.

With all of this data at your fingertips, you can effectively optimize your sales process and ensure that no effort is wasted. Your sales team will know exactly what to focus on, improving their performance and accelerating the overall growth of your cannabis business.
Purchasing Metrics
Purchasing Metrics can help you to better understand your customer behavior down to the product level. The Purchase Metrics table in myBI provides sell-through statistics by product — which retailers purchased a product, when, and how many orders in total included this product. With this information, you can easily determine the products your customers buy most and their average time frame for repurchasing.

The table below Purchase Metrics breaks down product sales by First Orders vs. Repurchases. You can track the performance of both new and staple products, and see which ones are being repurchased or ordered for the first time. If you’re not seeing the results you want, it may be time to consider shifting your sales and advertising efforts.
Want to download data from myBI for sharing? You can export any/all myBI data for easy sharing across your organization with just a few clicks.
How can you use myBI to improve your sales efforts?
The Sales, Summary, and Purchasing Metrics tabs are just a few of the many myBI tools for better understanding your customer’s purchasing habits and the performance of your sales team. Making the most of your LeafLink experience starts with understanding the data in front of you and using it to improve your sales approach.
Have more questions about how to use myBI to grow your business? Reach out to insights@leaflink.com or click here to learn more.
The Cannabis Industry’s Wholesale Marketplace
LeafLink connects over 2,300+ brands and 6,200+ retailers across 30 markets. Are you a brand? Request a demo. Retailer? Sign up to place your first order today.